
Stop waiting two months
for a dashboard.
Connect your data once. Ask for the report. Have it in minutes.
Free to start, no credit card required. Pay as you go, or pick a plan from $500 a month.
Cedar Point Residential · Juniper Flats · 212 units
Operating pulse
Needs attention
4- Upcoming notice exposure · 6 notices, 4 not yet re-leasedLeasing
- Make-ready queue · 4 units, oldest 11 daysMaintenance
- Delinquency follow-up · 9 residents over 30 daysOffice
- Traffic is not converting · 41 tours, 6 net rentalsLeasing
Physical occupancy
93.4%
▴ 0.8 pts vs last month
Leased
95.1%
▴ 1.2 pts
Total delinquency
$18,420
▾ 12% vs last month
NOI, month to date
$142.8k
3.1% above budget
Physical occupancy vs. operating floor
Where demand converts
Yardi, QuickBooks and budget sheet · captured today 6:00
- rows of business data under management
- 3.5B+
- rows of business data under management
- queries run on live data since June
- 860K+
- queries run on live data since June
- tool calls made by the agent
- 200K
- tool calls made by the agent
- requests from Claude, ChatGPT, Codex, the CLI and the API
- 350K+
- requests from Claude, ChatGPT, Codex, the CLI and the API
Production totals on Cerebro as of October 2026.
Eight jobs. One login. No team to hire.
A BI tool gives you the chart and leaves you the pipeline, the warehouse, the modeling and the ticket queue. Cerebro does all eight jobs, from pulling the data to acting on it, and you run it from a few prompts.
- 01ExtractPull from the tools you already pay forCRMs, accounting, ad accounts, property systems and your own Postgres, BigQuery, Snowflake or MySQL. Full snapshot every four hours; new columns show up on their own.
- 02StoreA warehouse you never have to runEvery source lands in one governed database with history. No Fivetran bill, no Snowflake contract, no pipeline to babysit.
- 03ModelDefinitions your whole company sharesGross revenue means one thing. Cerebro keeps the recipe behind each metric, versioned, and every answer and tile uses it.
- 04AskAsk in plain English, get the query tooThe analyst writes the SQL, checks its own totals against the source, and shows the work so one wrong number never sinks the whole thing.
- 05BuildDescribe a dashboard and watch it appearA branded page with tabs, drilldowns, downloads and tables your team can write to. Every change is saved and any version restores.
- 06ShareDecide who sees what, then send the linkLogins, per-org and per-user grants with expiry dates, and embeds that run inside Zoho, a client portal or a TV on the wall.
- 07AutomateReports and alerts that arrive on their ownPost tabs to Slack, email or SMS on a schedule, with an AI write-up of what changed. Set a threshold and get told the moment it trips.
- 08ActAct from the row, not from a ticketA button on any row updates the CRM, logs the call or hands work to Zapier, n8n or Zoho Flow, then clears the row.
The dashboard you would build with a free week. Built in minutes.
Ask for a layout and the assistant writes it: your colors, your section names, the metric definitions your team uses. Ask for a per-unit view or a new tab and it edits the page while you watch.
- Tabs, drilldowns, toggles and CSV downloads
- Every number traces back to a saved, governed query
- Full version history, with restore
- A grid view of the same tiles, one click away
Cedar Point Residential · 5 properties · 1,046 units
Where NOI comes from.
Portfolio NOI, T12
$6.42M
2.4% above underwriting
NOI per unit, T12
$6,138
▴ 3.2% vs last year
Opex ratio
41.2%
▾ 0.7 pts
Occupancy, weighted
92.8%
▴ 0.4 pts
Repairs and maintenance per unit, T12
Portfolio snapshot
| Property | Units | Occupancy | NOI / unit | vs budget |
|---|---|---|---|---|
| Mesa Verde Townhomes | 96 | 95.8% | $7,220 | +4.6% |
| Juniper Flats | 212 | 93.4% | $6,740 | +3.1% |
| Sagebrush Apartments | 270 | 93.0% | $6,050 | +0.7% |
| Larkspur Commons | 288 | 91.7% | $5,910 | −1.8% |
| Riverbend Lofts | 180 | 90.6% | $5,480 | −3.9% |
Every figure links to its property page · captured today 6:00
The report shows up before anyone asks for it
Pick the tabs or sections that matter and a schedule. Cerebro posts them to Slack, email, SMS or a webhook as images, with a link back to the live page. Turn on the AI write-up and the thread says what changed and what to do about it.

CerebroApp3:00 PM
Fulfillment scoreboard · afternoon
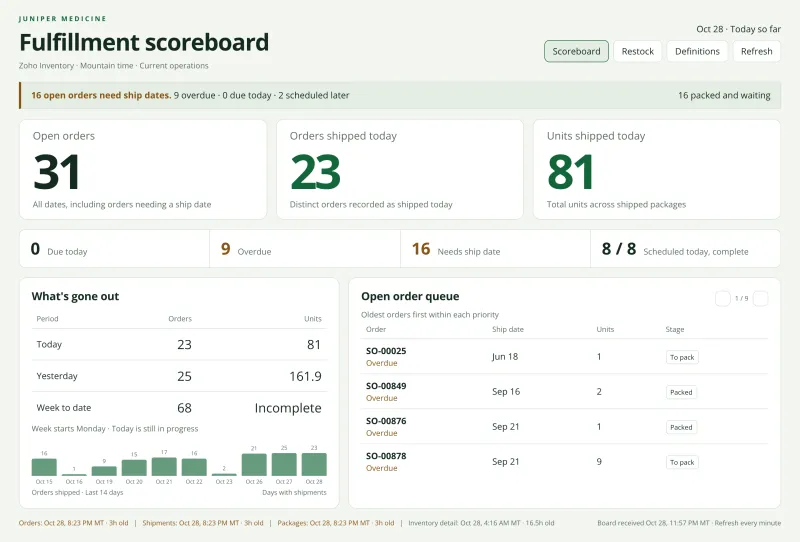
Thread · AI summary
- • 23 orders and 81 units out the door so far today.
- • 9 orders are overdue. The oldest has been waiting since June 18.
Afternoon fulfillment post
ActiveSchedule
Weekdays at 3:00 PM
Send to
Sections
- Scoreboard
- Open order queue
- Restock
- Definitions
Fix it from the dashboard.
Each row gets a button. Mark the contact as junk, log the call, flag the order as ready to bill, and the record changes in your CRM. The row hides or badges itself so the list shrinks as the team works.
Under the hood it is a signed webhook to Zoho Flow, Zapier, n8n or your own endpoint.
Not sure how to wire it? The assistant asks what the button should do and sets it up with you.
Dashboard actionsSummit Field Services · CRM hygiene
Spam review
In the queue
58
▾ 22 this week
Needs a decision
19
Hand raisers
4
check these first
Marked junk
312
last 30 days
Review queue
| Contact | Source | Reason | Created | |
|---|---|---|---|---|
| contact-88213 | Web form | Disposable email | Oct 19 | JunkNot spam |
| contact-88207 | Chat | Gibberish name | Oct 19 | ✓ Marked junk |
| contact-88191 | Web form | Duplicate phone | Oct 18 | JunkNot spam |
| contact-88174 | Paid social | Blocked domain | Oct 18 | JunkNot spam |
Zoho CRM · synced 3 min ago
Mark contact-88213 as junk?
Runs the junk function in your CRM for this contact and hides the row for 24 hours while the CRM syncs back.
- Contact
- contact-88213
- Reason
- Disposable email
Signed webhook to your CRM
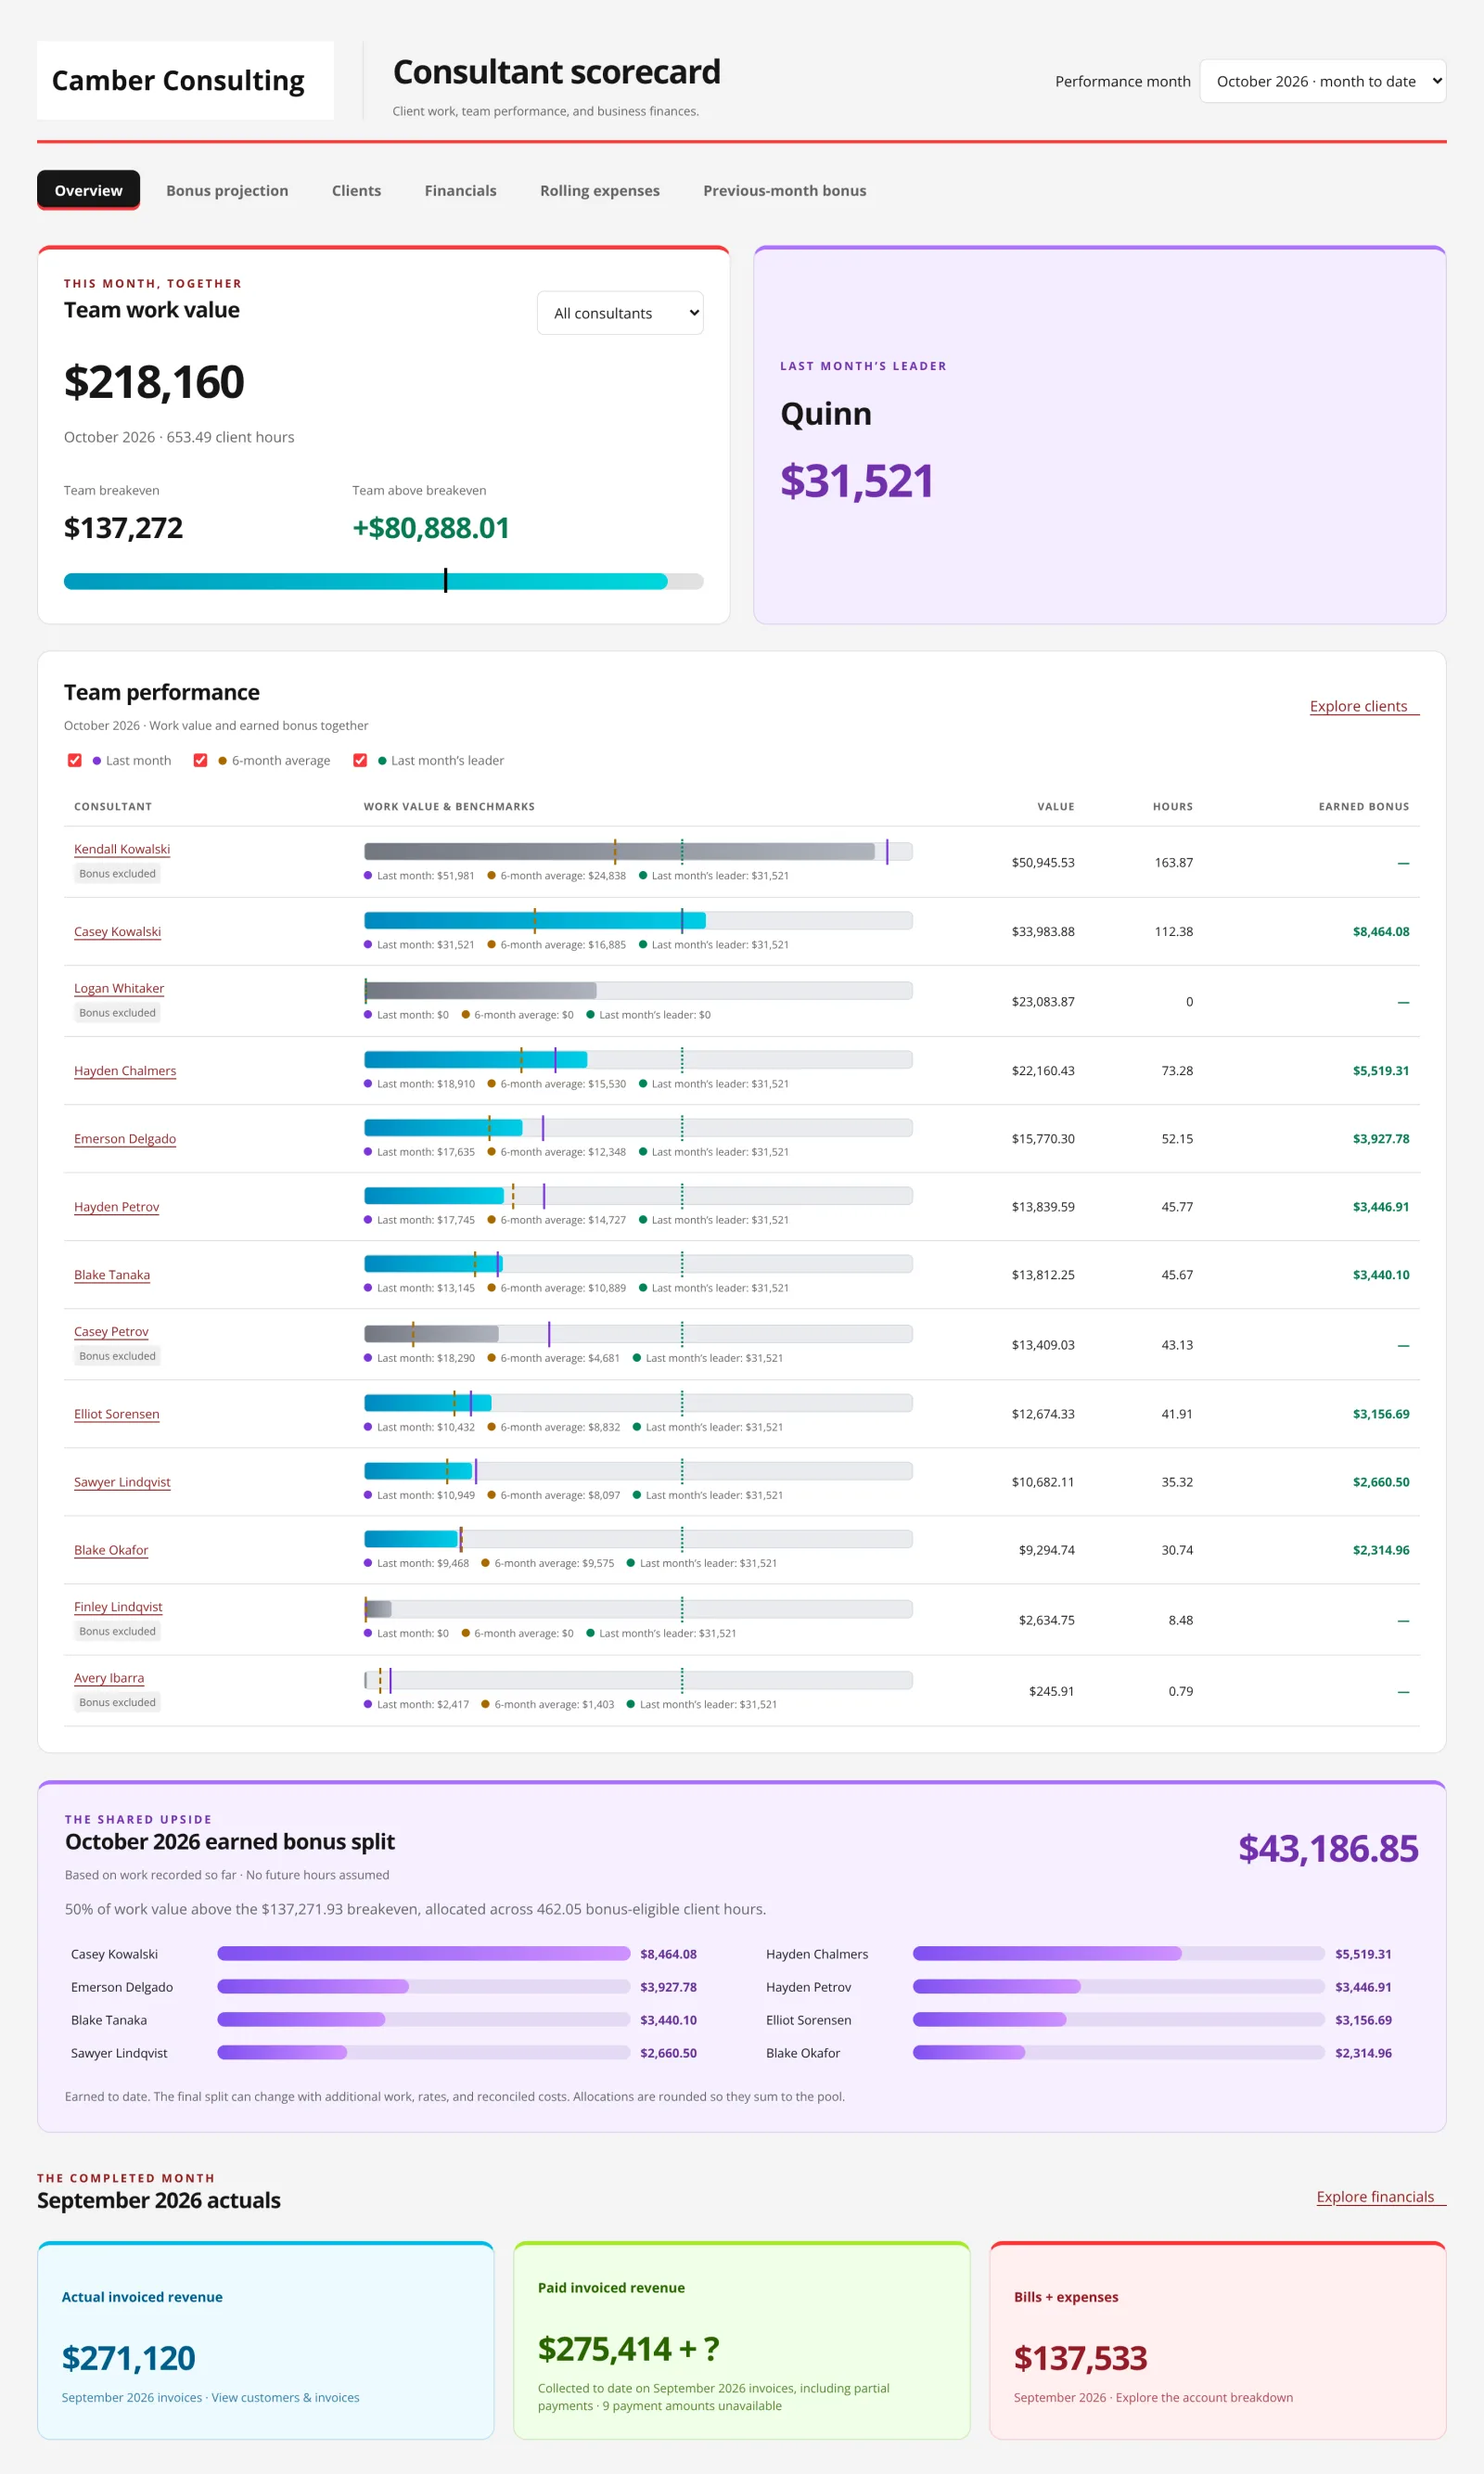
Real dashboards from real customers, with every name and number changed
These are captures from the app, not mockups. Each one runs for a customer today; we copied it, replaced the names and rescaled the numbers, and rendered it the way Cerebro does for a Slack post.
Brightpath Classroom Systems
Accounting · Finance workspace
Brightpath Classroom Systems · Finance
Signed work that hasn't been billed.
Open backlog
$2.84M
▴ 4%
Open orders
131
▾ 6
Partially billed
$812K
Over 90 days
17
▾ 3
Open sales orders
| Order | Customer | Open amount | Age | |
|---|---|---|---|---|
| SO-10482 | Westlake Unified | $118,600 | 64d | Ready to bill |
| SO-10511 | Cedar Valley Schools | $88,250 | 41d | ✓ Sent to billing |
| SO-10530 | Harbor County ISD | $47,300 | 18d | Ready to bill |
| SO-10397 | St. Brendan Academy | $30,950 | 112d | Ready to bill |
Accounting and CRM · synced 8 min ago
Put the dashboard where the work already happens
Turn on an embed and the dashboard gets a link that runs live inside a Zoho CRM tab, an accounting app, a client portal or a TV on the shop wall. Viewers don't need a Cerebro login, and the numbers stay current.
Agencies and consultants run every client from one login. Build a dashboard once, share it across client orgs, and decide who can query which source, with an expiry date.
The same analyst in Slack, Claude, ChatGPT, Codex and your terminal
Cerebro's MCP server and CLI expose the same 67 capabilities as the app, including building and editing dashboards. A REST API brings dashboards and their results into your own code. Your access rules apply everywhere.
Claude
cerebro · connectedcerebro · dashboard_list
cerebro · query_run
cerebro · dashboard_render
Riverbend Lofts is 3.9% under budget. In total it looks fine, but per unit its repairs and maintenance cost is $1,180, the highest in the portfolio. I pulled the NOI map with the per-unit view on.
Cedar Point Residential · 5 properties · 1,046 units
Where NOI comes from.
Portfolio NOI, T12
$6.42M
2.4% above underwriting
NOI per unit, T12
$6,138
▴ 3.2% vs last year
Opex ratio
41.2%
▾ 0.7 pts
Occupancy, weighted
92.8%
▴ 0.4 pts
Every figure links to its property page · captured today 6:00
$ cerebro dashboard list --org-id cedar-pointJuniper Flats · Operating pulse custom 7 tabsPortfolio · NOI map custom 1 tab$ cerebro dashboard render --org-id cedar-point --id noi-mapRunning 9 tiles against live data✓ Rendered 9 of 9 tiles · noi-map.png
- Claude, ChatGPT and CursorHosted MCP server. Sign in once and your orgs come with you.
- Codex and Claude CodePlugins and the CLI, for agents that build dashboards from a repo.
- SlackDM it or @mention it. Answers come back with the chart.
- REST APIRun approved queries and pull dashboards and results into your own code.
Every number traces to a query you can read
One wrong number and a team stops trusting the whole dashboard. So every answer ships with the SQL behind it, the analyst checks totals against the source before it replies, and every tile uses the metric definitions your team agreed on.
Read-only by default
Database connections are read-only. The agent writes to an app only after you approve the action.
Zero Data Retention
Switch on ZDR per user and the agent only uses models under zero-retention terms.
Grants with expiry
Decide which org or person can query each source, and for how long.
Sandboxed dashboards
Custom dashboards run in a sandbox and can only reach data through Cerebro.
Queried ad spend · 4 sources
Joined CRM leads by first touch
Cost per lead fell 7% to $38. Google Ads did most of the work: 142 leads at $31 each. Meta leads cost $47 and booked at half the rate.
Checked: lead totals match the CRM for October
Query access
Warehouse · Postgres · read-only
| Granted to | Access | Expires |
|---|---|---|
| OrgBluefin Logistics | Their schema only | Never |
| UserContract analyst | Finance views | Dec 31 |
| OrgAudit firm | GL tables | Nov 15 |
Wherever your numbers live, usually connected in a day
QuickBooks, Zoho, HubSpot and the ad accounts connect in minutes. Most new sources, custom systems included, are live within a day.
CRM and sales
 Zoho CRM
 HubSpot
 Salesforce
 HighLevel
 Pipedrive
Finance and payments
 QuickBooks
 Zoho Books
 Stripe
 PayJunction
 Business Central
Marketing and ads
 Google Ads
 Meta Ads
 TikTok Ads
 GA4
 Klaviyo
Industry systems
 Yardi
 AppFolio
 Restaurant365
 Tripleseat
 Freshdesk
Databases and spreadsheets
 Postgres
 BigQuery
 Snowflake
- SQLMySQL
 Google Sheets
- XLSExcel and SharePoint
Custom and legacy systems
An ERP with no public API, a vendor portal that only exports files, the database behind an app you built. If the data can leave the system, we can bring it in.
Industry software
Yardi, AppFolio, Restaurant365, Tripleseat, Monday boards and delivery systems like WorkWave, synced on a schedule.
Spreadsheets and files
Google Sheets, Excel and SharePoint folders stay synced, so budgets and targets join the rest of your data.
People who build on Cerebro
“One prompt turns into a dashboard that's incredibly useful for somebody, and it took me 15 minutes.”
“I would cancel all my analytics tools right now because Cerebro is just so much easier and faster when it comes to finding information, numbers and really anything else. Not to mention it's much, much, MUCH more robust with what you can do.”
“I had to search through thousands of records today for something that isn't easily searchable in Zoho, and Cerebro did it very quickly and then gave me the SQL code that I could run myself to generate a report to share with the client for verification.”
“This is going to give ops a look into the business they've never had.”
“The data audits alone were taking us 252+ hours every year. This cuts that dramatically. It's exactly what we've needed for a very long time. It gives us the transparency and accuracy to make better decisions about our business.”
“I can just click and get everything I need. It's what a Looker Studio report would have looked like if we'd spent a few thousand dollars building it.”
Don't want to build it yourself? Our engineers will.
Most teams on Cerebro started with a setup sprint. We connect every system, including the ones with no API, build the first three to five dashboards and meet you twice a week until the numbers match how you think. Then a plan keeps it running.
Data sync call
30 minutes. We connect a tool or two and pull a slice of data.
The build
Two to three weeks. Pipelines from every system, three to five dashboards.
Fine tuning
You bring the asks. Most get done on the call.
Ongoing
A monthly plan, and a weekly check-in for as long as you want it.
We ship every week
v5.2 · October 28, 2026
Alerts
- Data alerts
- Dashboard feedback
- Google Sheets and Excel sync into Cerebro Tables
v5.1 · October 25, 2026
Tables
- Cerebro Tables
- Sync to Cerebro for PostgreSQL
- Dashboards open about four times faster
v5.0 · October 18, 2026
Actionable
- Dashboard actions
- Scheduled Slack posts by tab and section
- PayJunction and Zoho Partner connectors
Start free. Pay for what you use.
Everything runs on one pool of credits: syncing data, asking questions, rendering dashboards and running automations. 100 credits cost $1.
Free
$0to start
Connect a few sources and build your first dashboards.
- 5,000 credits every 4 weeks
- 10,000 with a card on file
- Custom dashboards, chat and automations
Pay as you go
100 credits = $1
Add credits when you need more. No commitment.
- One pool for syncs, questions, dashboards and automations
- Buy only what you use
- Move to a plan any time
Plans
From $500/ month
Included credits, more organizations and priority support.
- Starter, Growth, Scale and Partner
- Up to 20 client organizations
- Your own databases from Growth up
Questions people ask before signing up
Do I need to know SQL or code to build a dashboard?
No. You describe what you want and the dashboard assistant writes the queries and the page. If you do know SQL, you can read and edit every query behind every tile.
Can I really build custom dashboards myself, without your team?
Yes. Consultants, operators and agency owners build their own dashboards on Cerebro, for their own business and for their clients. Our team is around if you want help with a hard build or a new connector.
Where does my data live?
Synced data lives in Cerebro's warehouse. Live database connections are queried in place, read-only. Turn on Zero Data Retention for a user and their agent only uses models under zero-retention terms.
Can my clients see dashboards without a Cerebro login?
Yes. Turn on an embed and the dashboard gets a link you can open on its own or place inside a CRM tab, accounting app or client portal. Viewers don't need an account.
Does it work with Claude, ChatGPT or Codex?
Yes. Connect the Cerebro MCP server, or install the CLI, and the same capabilities as the app are available there, including querying data and building and editing dashboards.
How does pricing work?
Everything runs on credits, and 100 credits cost $1. You start free with 5,000 credits every 4 weeks, buy more as you go, or move to a plan from $500 a month that includes credits and more organizations.
Sign up and build your first dashboard today
Connect a source, describe what you want to see and have a live dashboard before your next meeting. Free to start.